years <- as.character(2023:2023)
for (year in years[!file.exists(years)]) {
  tf <- tempfile('climate', fileext = '.tar.gz')
  download.file(url = paste0('https://www.ncei.noaa.gov/data/global-summary-of-the-day/archive/',
                             year, '.tar.gz'),
                destfile = tf)
  untar(tf, exdir = year)
}
# col_date(format='%F')
coltypes <- readr::cols_only(STATION='c',
                        DATE=readr::col_date(format = '%F'),
                        LATITUDE='d',
                        LONGITUDE='d',
                        ELEVATION='d',
                        NAME='c',
                        TEMP='d')

dat0 <- dplyr::bind_rows(lapply(list.files(path=years, full.names = TRUE),
readr::read_csv, col_types=coltypes))Sun Drives Weather
2024-02-07
Background
The National Oceanic and Atmospheric Administration publishes freely accessible daily climate data from thousands of weather stations in the world.
I wondered how much daily average temperature in each station can be explained by solar irradiation alone.
It also peeked my interest how well statistical linear models could handle the amount of data from meteorology.
Let’s see!
Data
peek into data
# A tibble: 4,038,747 × 7
   STATION     DATE       LATITUDE LONGITUDE ELEVATION NAME       TEMP
   <chr>       <date>        <dbl>     <dbl>     <dbl> <chr>     <dbl>
 1 01001099999 2023-01-01     70.9     -8.67         9 JAN MAYE…  18.1
 2 01001099999 2023-01-02     70.9     -8.67         9 JAN MAYE…  25.8
 3 01001099999 2023-01-03     70.9     -8.67         9 JAN MAYE…  35.8
 4 01001099999 2023-01-04     70.9     -8.67         9 JAN MAYE…  37
 5 01001099999 2023-01-05     70.9     -8.67         9 JAN MAYE…  35.4
 6 01001099999 2023-01-06     70.9     -8.67         9 JAN MAYE…  32.7
 7 01001099999 2023-01-07     70.9     -8.67         9 JAN MAYE…  34.7
 8 01001099999 2023-01-08     70.9     -8.67         9 JAN MAYE…  35.2
 9 01001099999 2023-01-09     70.9     -8.67         9 JAN MAYE…  34
10 01001099999 2023-01-10     70.9     -8.67         9 JAN MAYE…  31.6
# ℹ 4,038,737 more rows
data quality
   STATION               DATE               LATITUDE        LONGITUDE
 Length:4038747     Min.   :2023-01-01   Min.   :-90.00   Min.   :-179.983
 Class :character   1st Qu.:2023-04-01   1st Qu.: 23.84   1st Qu.: -82.454
 Mode  :character   Median :2023-07-02   Median : 40.08   Median :   8.517
                    Mean   :2023-07-01   Mean   : 31.66   Mean   :  -1.280
                    3rd Qu.:2023-10-02   3rd Qu.: 49.22   3rd Qu.:  64.230
                    Max.   :2023-12-31   Max.   : 83.65   Max.   : 179.500
                                         NA's   :13408    NA's   :13408
   ELEVATION          NAME                TEMP
 Min.   :-999.9   Length:4038747     Min.   :-114.30
 1st Qu.:  31.0   Class :character   1st Qu.:  42.70
 Median : 155.1   Mode  :character   Median :  59.70
 Mean   : 361.8                      Mean   :  56.49
 3rd Qu.: 446.2                      3rd Qu.:  74.10
 Max.   :4701.0                      Max.   : 110.00
 NA's   :13770
“-999.9” as missing elevation and other fixes
convert temperature to Celsius and elevation to km (for numerical reasons)
how many observations per station?
 351  352  353  354  355  356  357  358  359  360  361  362  363  364  365
  63  111  171  102   75  100   99   86  117  151  220  354  459  702 6032
About half of the stations have an observation for each day in 2023.
Let’s concentrate on the stations with at least 360 observations -
and remove all stations with missing coordinates.
base data
This data now provides my base for investigation.
functions for insolation and maximum sun elevation
From Jean Meeus’ book “Astronomical Algorithms” good approximations for solar irradiation per day and maximum sun elevation can be computed - see code for details.
# sun declination
declination <- function(J2000T) asin(sin(epsilon(J2000T)) * sin(lambda(J2000T)))

# irradiation in kWh per m^2 per day
insolation <- function(J2000T, latitude) {
  rho <- rho(J2000T)
  h0 <- h0(J2000T, latitude)
  x <- sin(epsilon(J2000T)) * sin(lambda(J2000T))
  10.4033856721 * rho*rho * (h0*sin(latitude)*x + cos(latitude)*cos(asin(x))*sin(h0))
}
add sun parameters to dataframe
With astronomical functions in place I can compute for each observation the daily sun irradiation energy per m^2 and the sine of maximum sun elevation.
dat <- dat1 |>
  dplyr::group_by(STATION) |>
  dplyr::mutate(
    insolation=insolation(J2000_cent(as.POSIXct(DATE)+43200), pi*LATITUDE/180),
    delta_sol= ifelse(DATE==lag(DATE)+1, 100*(insolation-lag(insolation)), NA),
    maxsun = cos(pi*LATITUDE/180-declination(J2000_cent(as.POSIXct(DATE)+43200))),
    delta_maxsun=ifelse(DATE==lag(DATE)+1, 100*(maxsun-lag(maxsun)), NA)) |>
  ungroup() |>
  dplyr::filter(!is.na(delta_sol), !is.na(delta_maxsun))
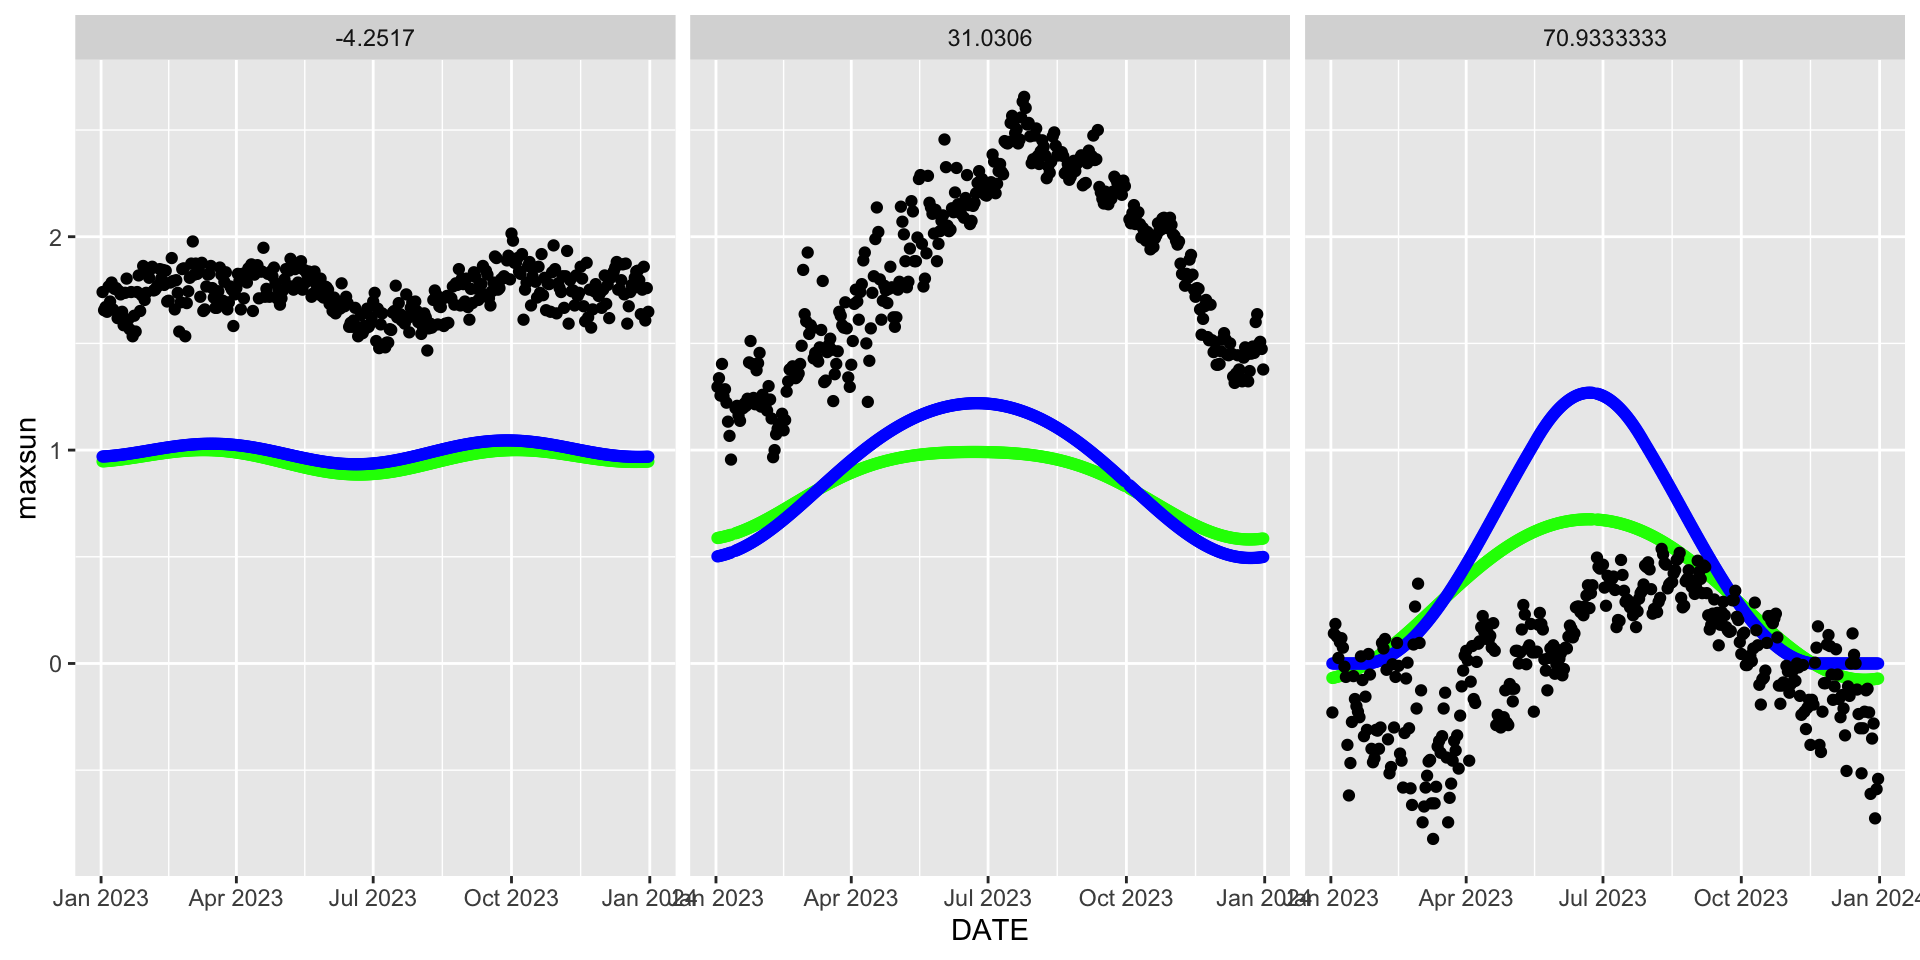
sun parameters at diffent latitudes

a parsimonious mixed effect model
m0 <- lme4::lmer(TEMP ~ ELEVATION + insolation * delta_maxsun + (delta_maxsun|STATION),
                 data=dat)
summary(m0)
Linear mixed model fit by REML ['lmerMod']
Formula: TEMP ~ ELEVATION + insolation * delta_maxsun + (delta_maxsun |
STATION)
Data: dat
REML criterion at convergence: 16761814
Scaled residuals:
Min 1Q Median 3Q Max
-13.5352 -0.5366 0.0216 0.5887 6.3420
Random effects:
Groups Name Variance Std.Dev. Corr
STATION (Intercept) 41.38 6.433
delta_maxsun 31.36 5.600 0.75
Residual 19.75 4.444
Number of obs: 2866271, groups: STATION, 7894
Fixed effects:
Estimate Std. Error t value
(Intercept) -1.3189055 0.0799846 -16.49
ELEVATION -2.6139726 0.1041290 -25.10
insolation 2.0087287 0.0008365 2401.31
delta_maxsun -0.7451291 0.0679113 -10.97
insolation:delta_maxsun -1.2813487 0.0034485 -371.56
Correlation of Fixed Effects:
(Intr) ELEVAT insltn dlt_mx
ELEVATION -0.416
insolation -0.081 -0.002
delta_maxsn 0.627 -0.001 -0.004
insltn:dlt_ -0.003 0.005 0.009 -0.342deal with phase lag of sun and temperature

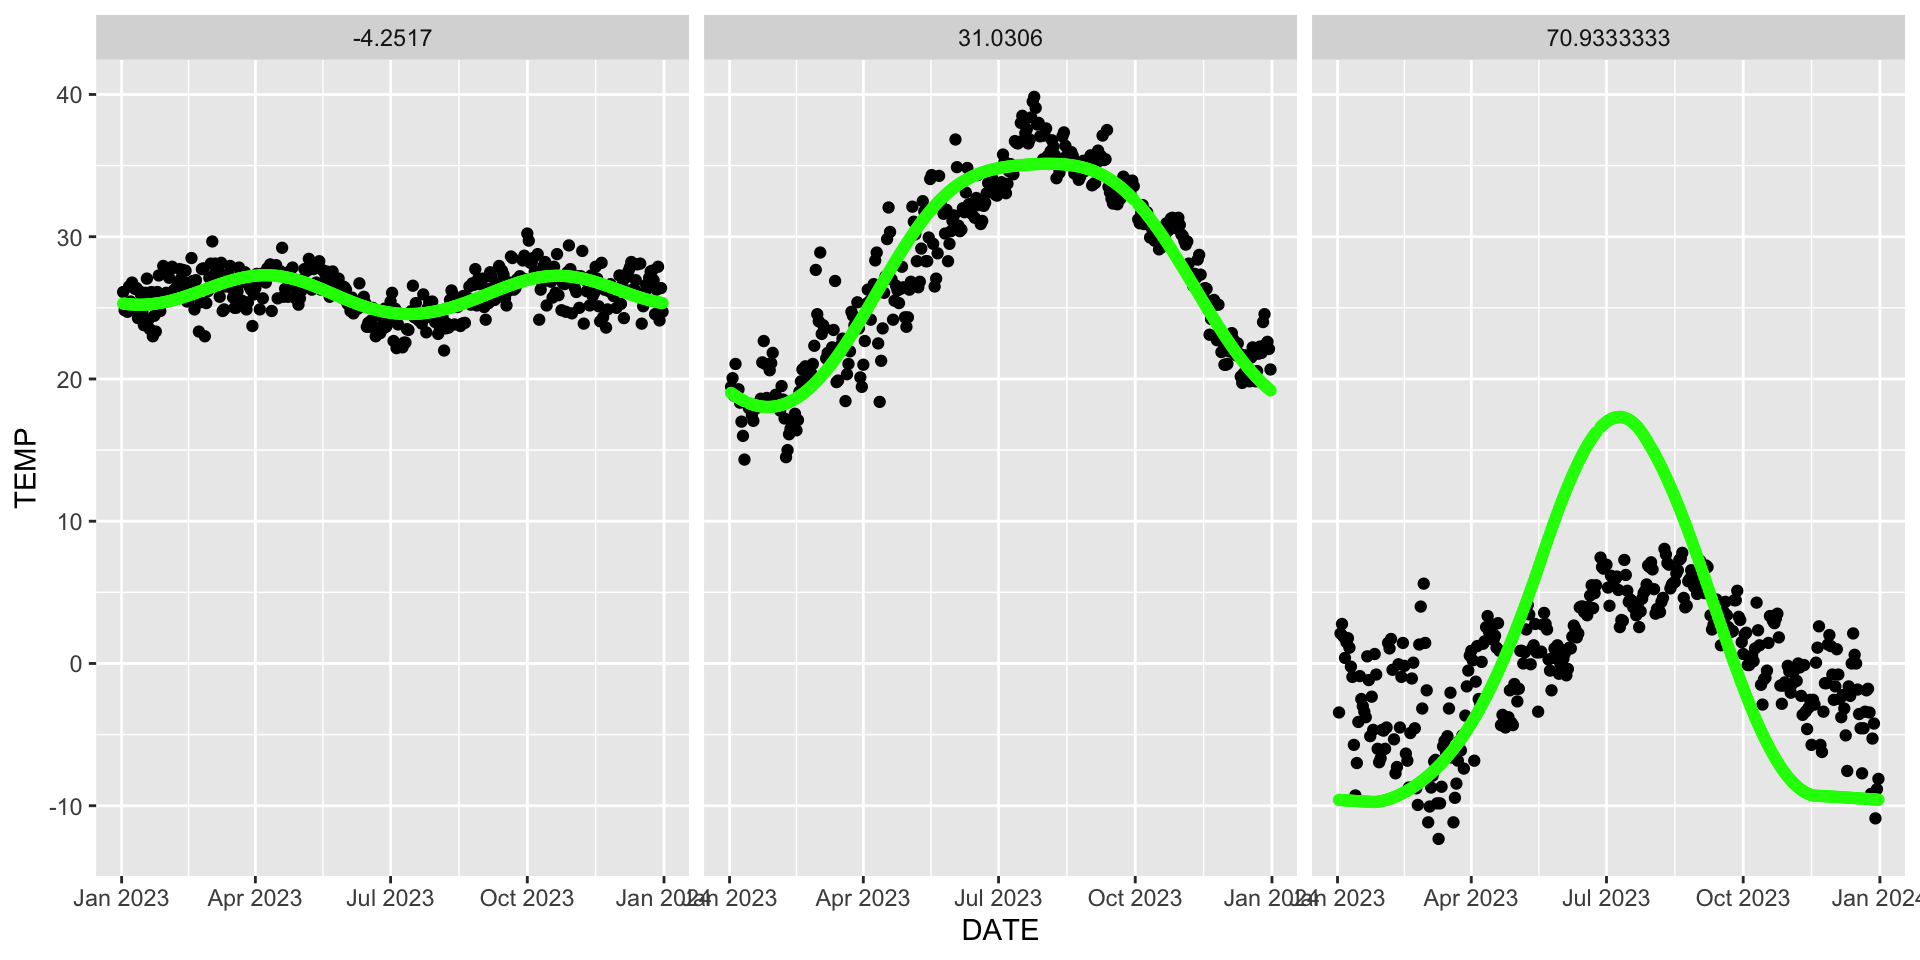
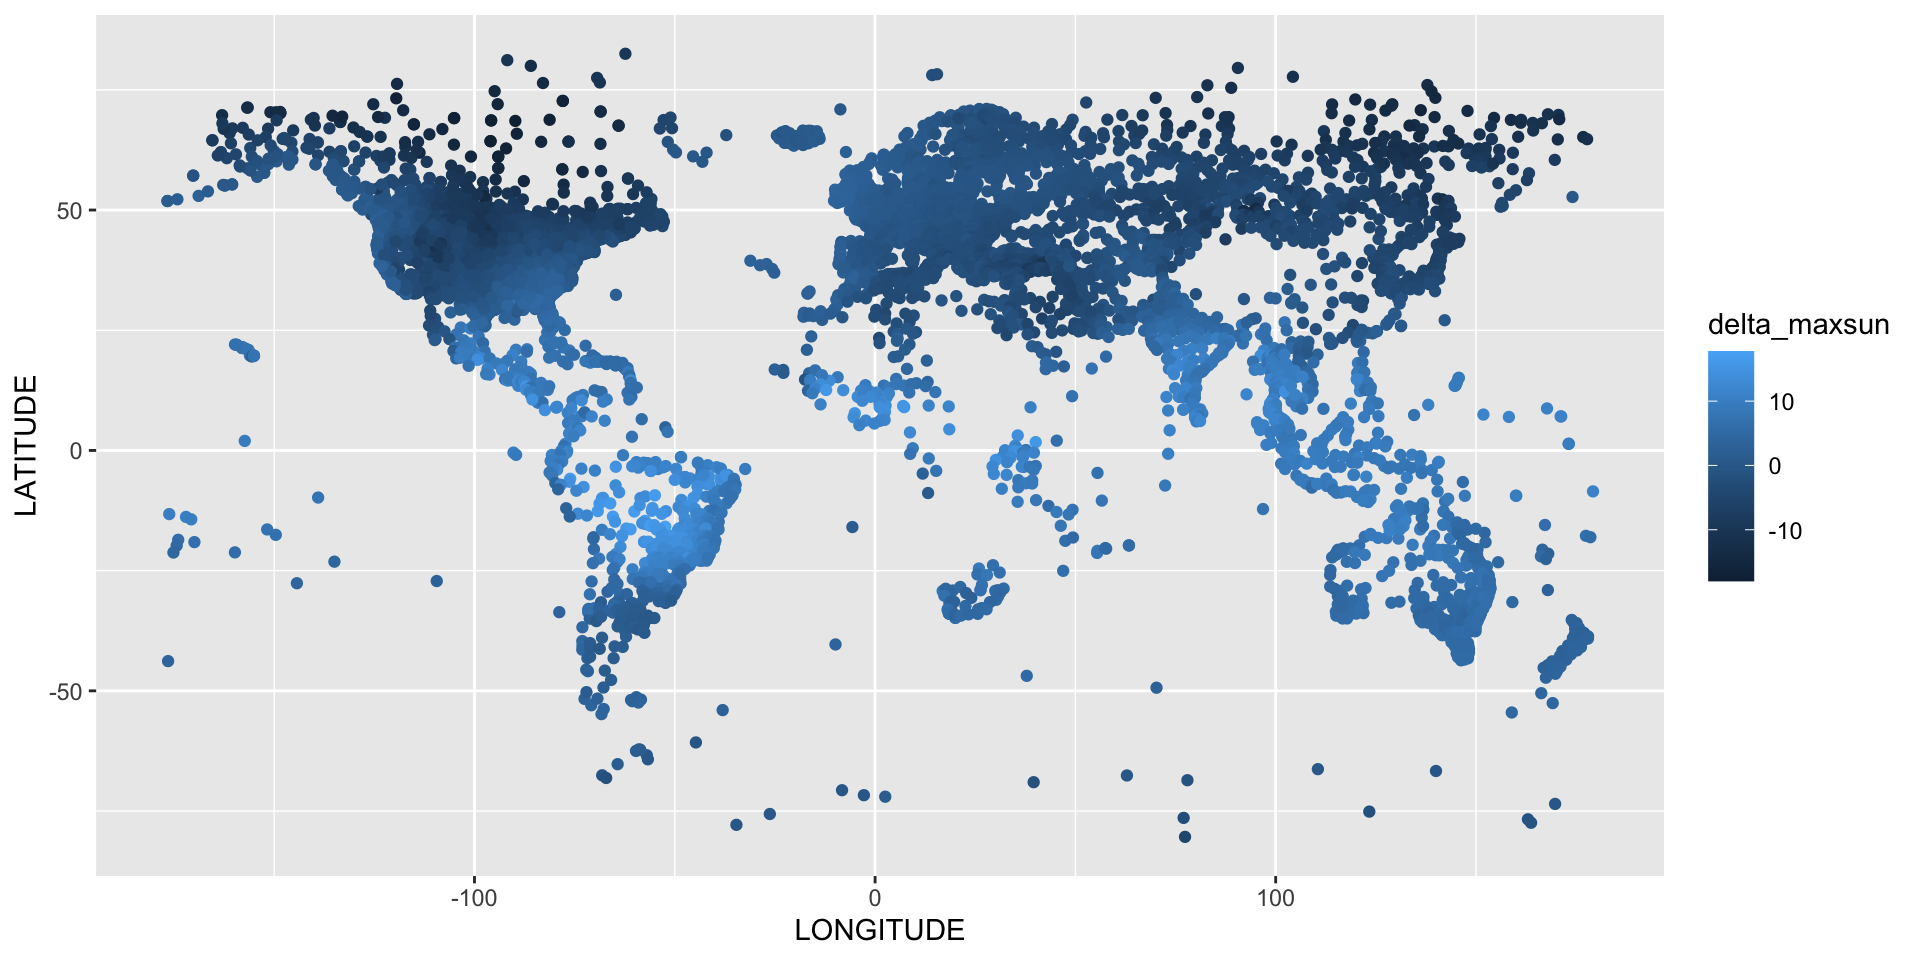
station specifics
station plot

source in https://github.com/BaselDataScience/baseldatascience.github.io/blob/main/posts/sun_weather.qmd